
It’s 11:47 p.m. the night before a major flash sale. Your on-call engineer gets paged: The checkout service is returning 503s. Cart abandonment is spiking. Revenue loss is accumulating at roughly $8,000 per minute. The postmortem will later reveal that the downstream payment gateway became slow — not down, just slow — and your checkout service had no timeout configured. Every thread blocked. The pod ran out of connections; then it crashed.
This scenario plays out across the retail industry with painful regularity. The root cause is almost never a surprise — timeouts, cascading failures, single points of failure, unvalidated retry logic — the classics. What is surprising is that in 2026, most teams still discover these weaknesses in production rather than in their CI/CD pipelines, where the cost of failure is a failed build, not lost revenue.
Chaos engineering — the discipline of deliberately injecting failure to discover systemic weaknesses — has matured significantly since Netflix popularized it with Chaos Monkey. What was once a practice reserved for companies with massive platform engineering budgets is now a realistic addition to any CI/CD pipeline. This article walks through what that looks like concretely, using an e-commerce checkout flow as our example system.
The question is not whether your system will fail under stress. The question is whether you will be the first to know about it.
What Chaos Engineering Actually Means in a Pipeline Context
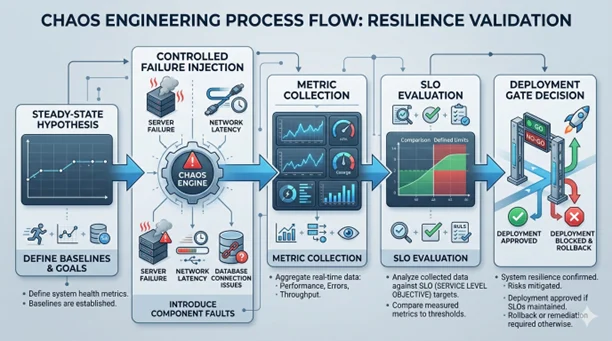
Chaos engineering is often misunderstood as ‘randomly breaking things in production’. That description captures the sensational origin story but misses the discipline entirely. The principles of chaos engineering define it as the practice of running controlled experiments on a distributed system to build confidence in the system’s capability to withstand turbulent conditions.
The keyword is controlled. You define a steady-state hypothesis (our checkout service should complete 99% of transactions within 2 seconds), you run a precisely scoped experiment (inject 800 ms of latency into the payment gateway) and you observe whether your hypothesis holds. If it doesn’t, you’ve found a real weakness — in a controlled environment, before your customers found it.
When we bring this into a CI/CD pipeline, the goal is to gate deploys on resilience, not just correctness. A microservice that passes all its unit tests but has no circuit breaker for external dependencies is functionally wrong — it just hasn’t manifested that wrongness yet. Chaos gates in the pipeline surface this class of defects before they ship.
Key Distinction
Chaos engineering ≠ load testing. Load testing verifies that your system behaves correctly at high volume. Chaos engineering verifies that your system behaves correctly when its dependencies misbehave. Both are necessary. Neither replaces the other.
Where Chaos Fits in the CI/CD Pipeline
Chaos experiments don’t replace your existing test stages — they extend them. The natural insertion point is after integration tests pass but before production deployment. At this stage, you have a representative environment (staging or a dedicated chaos namespace), real service wiring and enough confidence in the code’s correctness to start probing its resilience.
The pipeline flow with a chaos gate looks like this:
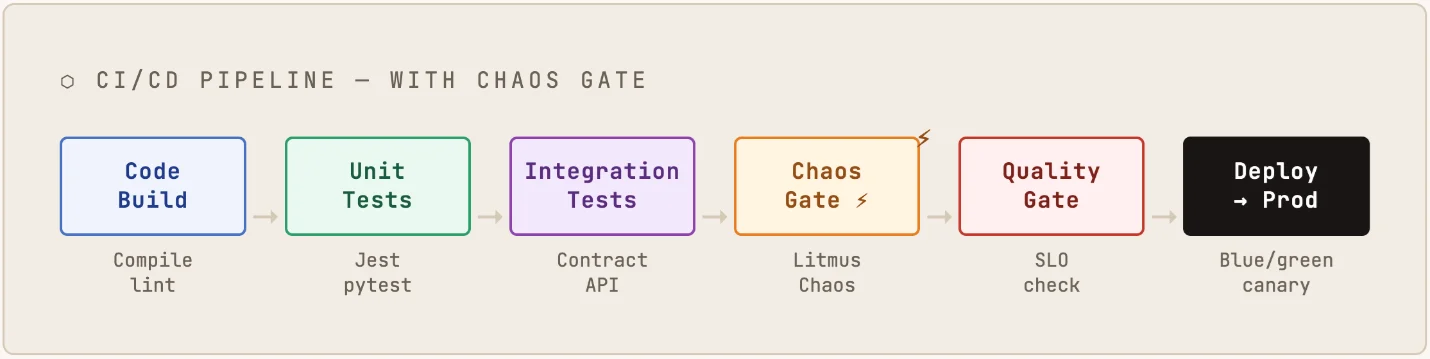
The chaos gate stage runs a predefined set of experiments against the staging environment, collects metrics and evaluates them against SLO thresholds. If the service degrades gracefully — serving fallback responses, respecting timeouts, not causing upstream failures — the gate passes. If it doesn’t, the deploy fails with a detailed report, showing exactly which scenario triggered the breach.
The E-Commerce Checkout System: Our Example
Let’s ground this in a realistic system. A typical modern e-commerce checkout service looks something like this:
- Checkout Service: Orchestrates the transaction (Node.js or Go)
- Inventory Service: Validates stock before reserving items
- Payment Gateway: External integration (Stripe, Adyen or proprietary)
- Pricing Engine: Applies promotions, discounts, loyalty points
- Order Service: Persists confirmed orders to the database
- Notification Service: Sends confirmation emails/SMS (via SQS or similar)
This is a classic fan-out topology. The checkout service calls several downstream services synchronously (inventory, payment, pricing) and one asynchronously (notification). Each synchronous call is a potential failure point.
Scenario 1: Payment Gateway Latency Injection
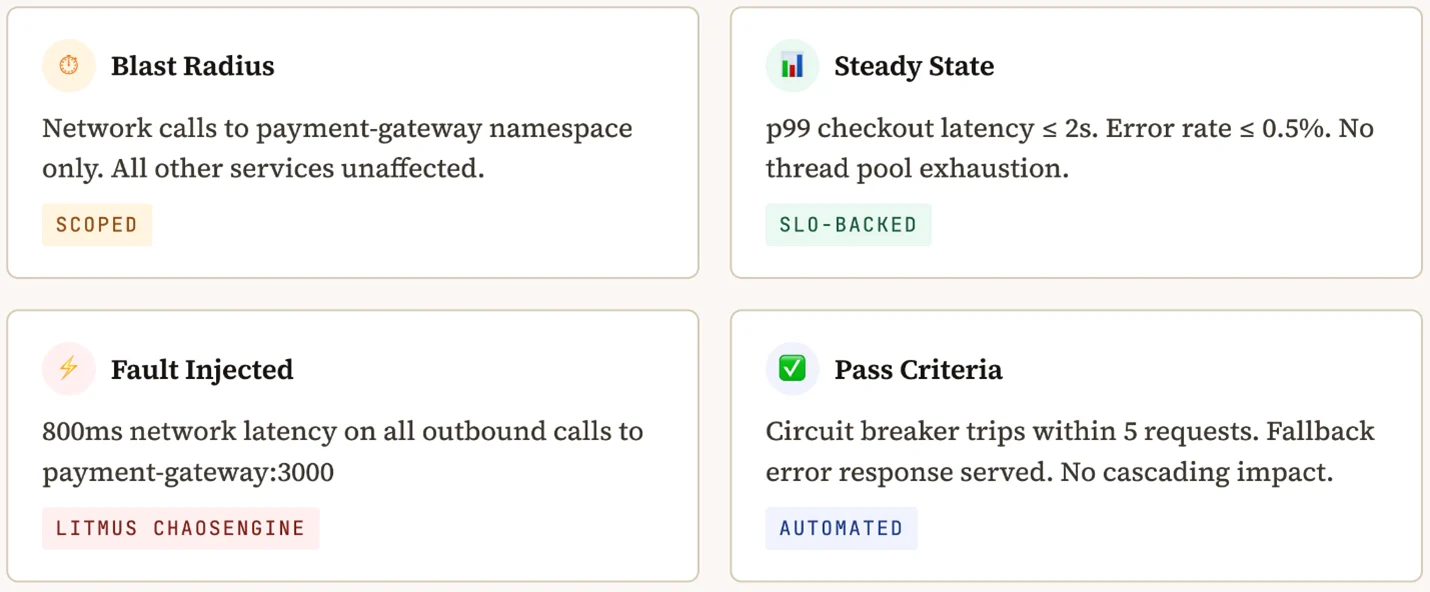
The Hypothesis
When the payment gateway responds slowly (800 ms instead of the typical 120 ms), the checkout service should reject the slow request via a timeout, return a user-friendly error to the caller and not exhaust its own thread pool — allowing subsequent transactions to proceed normally.
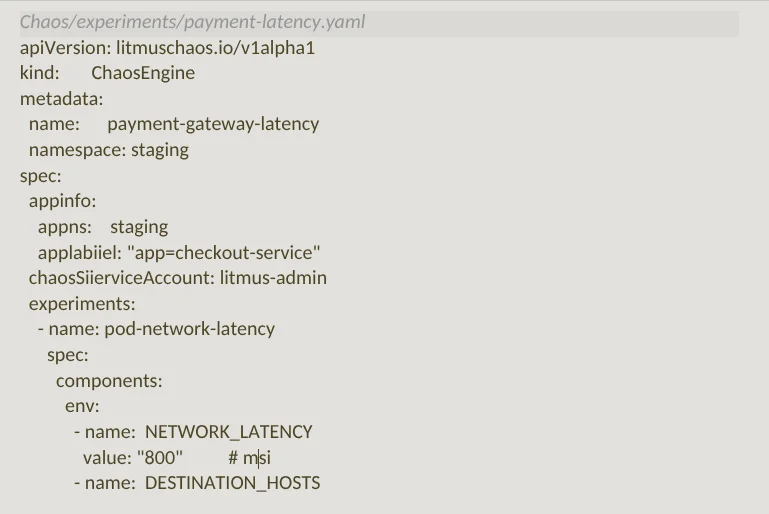
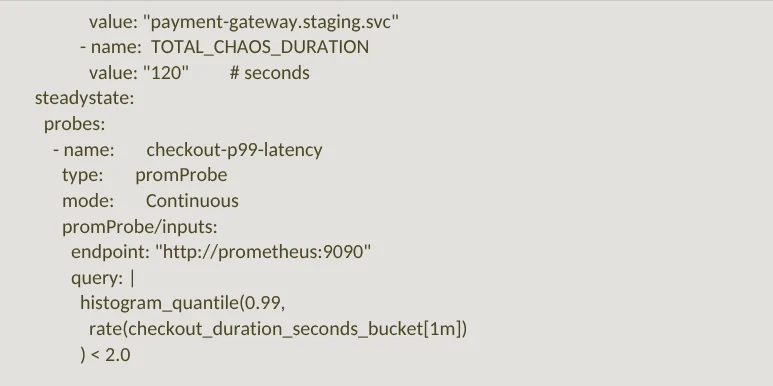
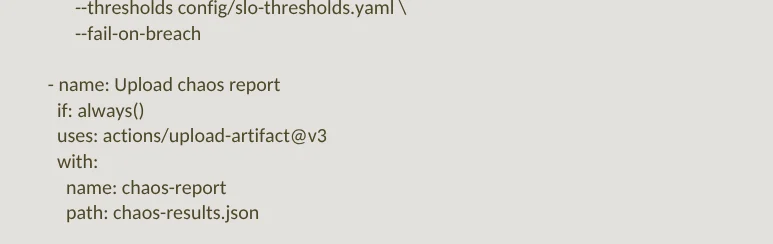
The CI step that runs this experiment in GitHub actions:
Pro Tip Use If: Always() on the Artifact Upload Step So You Always Get the Chaos Report, Even When the Gate Fails and Blocks the Deploy. This is Essential for Debugging Gate Failures Quickly.
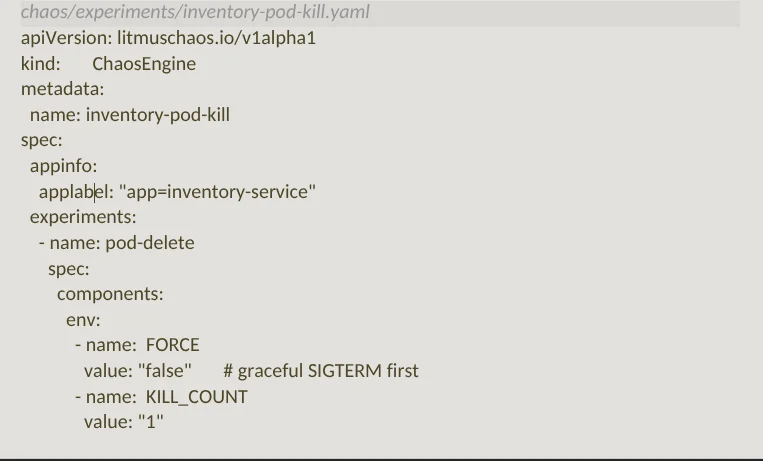
Scenario 2: Inventory Service Pod Kill
A pod kill simulates an instance crash — a pod terminates unexpectedly and Kubernetes restarts it. The question is: During the ~60-second window before the replacement pod is healthy, does the checkout service degrade gracefully or does it cascade?
The expected behavior is that the checkout service should detect the unavailability of inventory, serve a cached response or a graceful error and ‘not’ propagate the failure to the caller as an unhandled 500.

Common Failure Pattern
Various services fail this experiment because they call inventory synchronously without a circuit breaker, then return a 500 when inventory is unavailable. The correct behavior is to either (a) serve a degraded response backed by a short-lived cache or (b) allow the transaction to proceed optimistically and reconcile inventory post-payment — a pattern used by Amazon and most high-traffic retailers during flash sales.
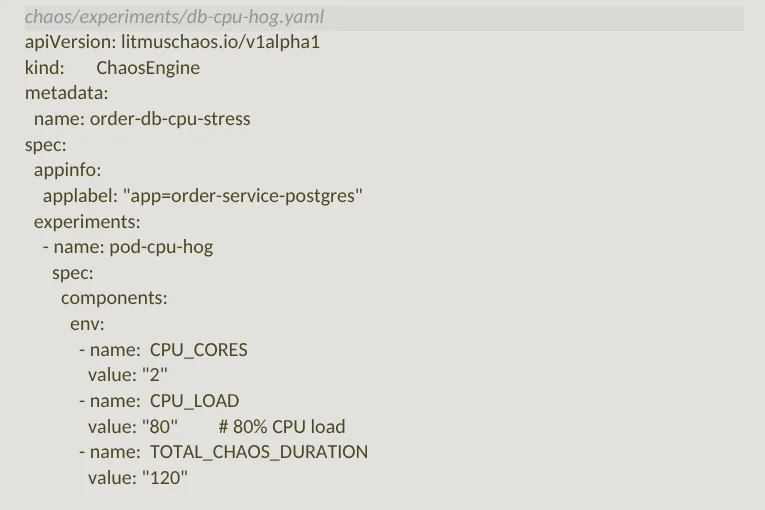
Scenario 3: Database CPU Starvation
This experiment simulates a noisy-neighbor scenario: The order service database pod gets hit with CPU stress, slowing down write operations. The steady-state hypothesis is that order placement should fall back to an async queue (SQS/Kafka) and return a ‘202 Accepted’ rather than blocking the user’s checkout experience.
Reading the Results: What Actually Happened
When a mid-size UK retailer (anonymized) first introduced these three experiments into their CI pipeline, here’s what they found on the first run:
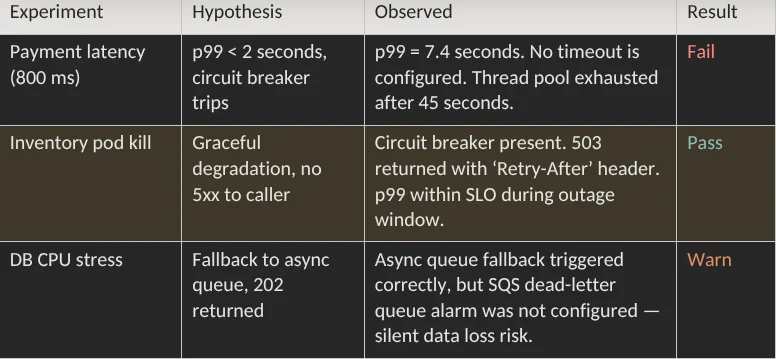
The payment latency failure was the critical find. Without a timeout on the payment gateway client, the thread pool saturated within 45 seconds, causing the checkout service itself to become unresponsive. This is textbook cascading failure — and it would have taken down the entire checkout during a peak event.
The fix was straightforward: Add a 300 ms timeout to the payment gateway HTTP client, configure a circuit breaker that trips after five consecutive timeouts and ensure the fallback returns a 429 with a human-readable message. The second run passed.
The chaos gate didn’t just find a bug. It found a bug that would have caused an outage during your highest-revenue window of the year.
The Resilience Health Endpoint Pattern
One pattern that simplifies chaos probes significantly is the resilience health endpoint — a dedicated endpoint that reports not just whether the service is up, but whether its resilience mechanisms are functioning.
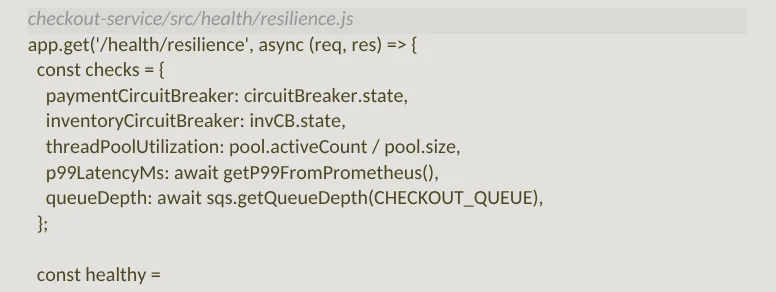
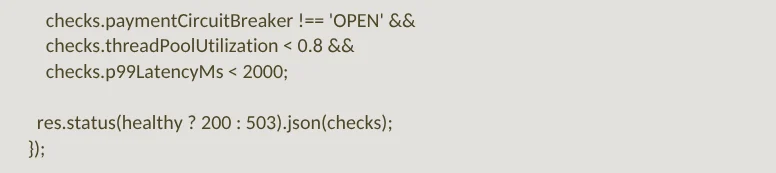
This pattern makes chaos probes trivially simple — the probe just hits GET/health/resilience and checks for 200. It also doubles as a useful debugging tool in production, giving on-call engineers immediate visibility into circuit breaker states and queue depths during an incident.
Operationalizing Chaos in the Team
The technical pieces are relatively straightforward. The harder part is building the culture and workflow around them.
1. Start With a Chaos Backlog
Before running any experiments, run a failure mode brainstorm with the team. Go through each service and its dependencies; for each dependency, write down what happens when it’s slow, when it’s down and when it returns garbage data. Each entry becomes a candidate chaos experiment. Prioritize by blast radius × frequency of the failure mode.
2. Run in Observe Mode Before Gate Mode
Don’t gate deploys on chaos results from day one. Run the experiments in observe mode for two to four weeks first — collect the data, understand what normal chaos results look like in your environment and build the baseline before you start failing builds.
3. Treat Chaos Failures as P2 Bugs
When a chaos experiment reveals a resilience gap, it should be filed as a bug (not a feature request) and triaged with appropriate urgency. A service with no circuit breaker for its payment dependency is carrying a known production risk.
4. Game Day Cadence
Once monthly, run a game day — a structured session where the team deliberately introduces chaos into the staging environment and practices the incident response workflow. This builds muscle memory for the real thing.
Tooling Landscape (2025)
Litmus Chaos — CNCF project, Kubernetes-native, good GitHub Actions integration. Best for teams already on K8s. Chaos Mesh — CNCF project, strong network fault capabilities, web UI. AWS Fault Injection Simulator (FIS) — Managed service, integrates with CloudWatch. Best for AWS-native stacks. Gremlin — Commercial, mature, excellent reporting. Steadybit — Commercial, strong on policy-based experimentation.
What Changes After Six Months
Teams that have run chaos gates in CI for six months consistently report three shifts. First, the nature of production incidents changes — cascading failures and timeout-related outages decrease significantly. Second, the on-call experience improves; engineers spend less time debugging timeout storms. Third, the conversation in design reviews changes — ‘what happens when this service is slow’ stops being theoretical and starts being a pipeline concern with measurable consequences.
For e-commerce teams specifically, the business case is clear. A single prevented Black Friday incident more than justifies the investment in chaos tooling and the pipeline time it adds (typically 4–8 minutes).
Chaos engineering doesn’t make systems more fragile. It makes teams more honest about how fragile they already are.
Getting Started: A 30-Day Path
If this is new to your team, here’s a concrete starting point:
Week 1: Map your critical path. For your most revenue-critical user flow, draw every synchronous dependency. These are your first experiment targets.
Week 2: Install Litmus Chaos in your staging cluster. Run the pod-delete experiment against a non-critical service to get familiar with the tooling. Don’t gate anything yet.
Week 3: Run the network latency experiment against your most critical external dependency. Observe results. Add the resilience health endpoint to the affected service.
Week 4: Write the CI stage. Add the chaos gate in observe mode — it reports results but doesn’t fail the build. Review the first week of results as a team.
Month 2+: Fix the identified gaps. Enable gate mode. Add experiments as the backlog grows.
The goal isn’t to have 50 chaos experiments running in CI by the next quarter. It’s to have the three experiments that are most likely to catch a production incident and to have the team’s attention trained on systemic resilience as a first-class engineering concern.