
The quarterly budget review arrives and the observability line item has doubled. The familiar response involves enabling aggressive sampling, dropping most traces, and cutting retention periods. These tactics might reduce costs temporarily, but they destroy your ability to debug production incidents when you need complete visibility.
Platform teams scaling Kubernetes deployments face a predictable crisis. What worked at 10 services collapses at 200 or more. The typical solution of sampling creates a worse problem where developers lose trust because critical traces are not available during incidents.
Platform teams effectively pay an “observability tax” twice. They pay once for poor telemetry decisions at the source and again for backends that force expensive workarounds downstream.
The Cardinality Explosion in Kubernetes
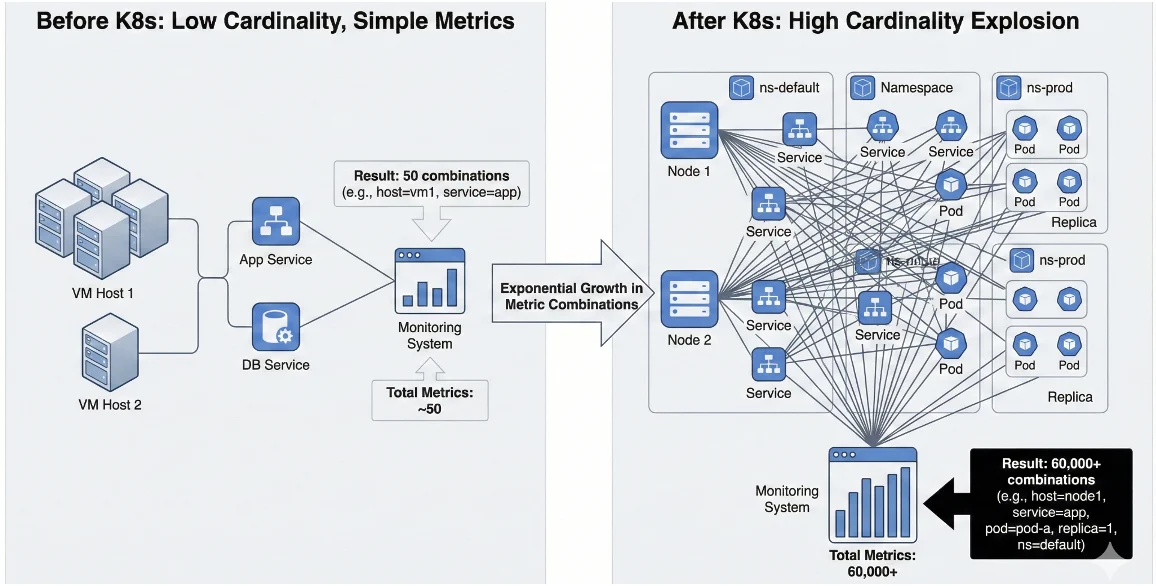
When organizations move to Kubernetes, telemetry volume explodes exponentially because every architectural dimension multiplies.
Consider a traditional deployment with 10 services across 5 hosts. This generates about 50 unique metric combinations. If you move that same application to Kubernetes, you might have 200 services with 20 pods per service across 3 replicas and 5 namespaces. That equals over 60,000 unique metric combinations. When you add distributed tracing with trace IDs, span IDs, pod names, and container IDs, the numbers become staggering.
Common Instrumentation Mistakes Amplify This:
- Over-instrumentation creates noise. The mentality of “log everything and figure it out later” results in a high ratio of noise to signal. This increases storage costs, degrades query performance, and causes alert fatigue.
- Thoughtless high-cardinality tags. A team might add user_id as a trace attribute for debugging. Six months later, the application has 10 million active users and the tracing backend collapses. Each unique user ID becomes a new dimension that multiplies storage and query costs.
- Unstructured logs. When logs are dumped as strings like “Error: user 12345 failed checkout” rather than structured data, full-text search across petabytes becomes slow and inefficient.
The Sampling Trap and OpenTelemetry Bottlenecks
According to the Cloud Native Computing Foundation’s FinOps for Kubernetes Microsurvey, 49% of organizations report increased costs after Kubernetes adoption, with over-provisioning cited as the primary driver. When observability bills spike, leadership demands immediate cost cuts. The reflexive solution: enable sampling.
Tail sampling attempts to keep all errors but sample successful requests. However, this shifts the burden to the collection layer. To decide whether to keep a trace, the system must see the entire trace first.
This decision usually happens in the OpenTelemetry Collector. The Collector must buffer all spans in memory before making a decision, which creates massive CPU and RAM spikes on your collection infrastructure.Platform engineers often spend weeks writing complex YAML rules only to find the critical trace was still dropped by a rule edge case during the next incident. Understanding how the OpenTelemetry Collector processes telemetry can help optimize these pipelines
The Hidden Cost of “Safety”: Rethinking Durability
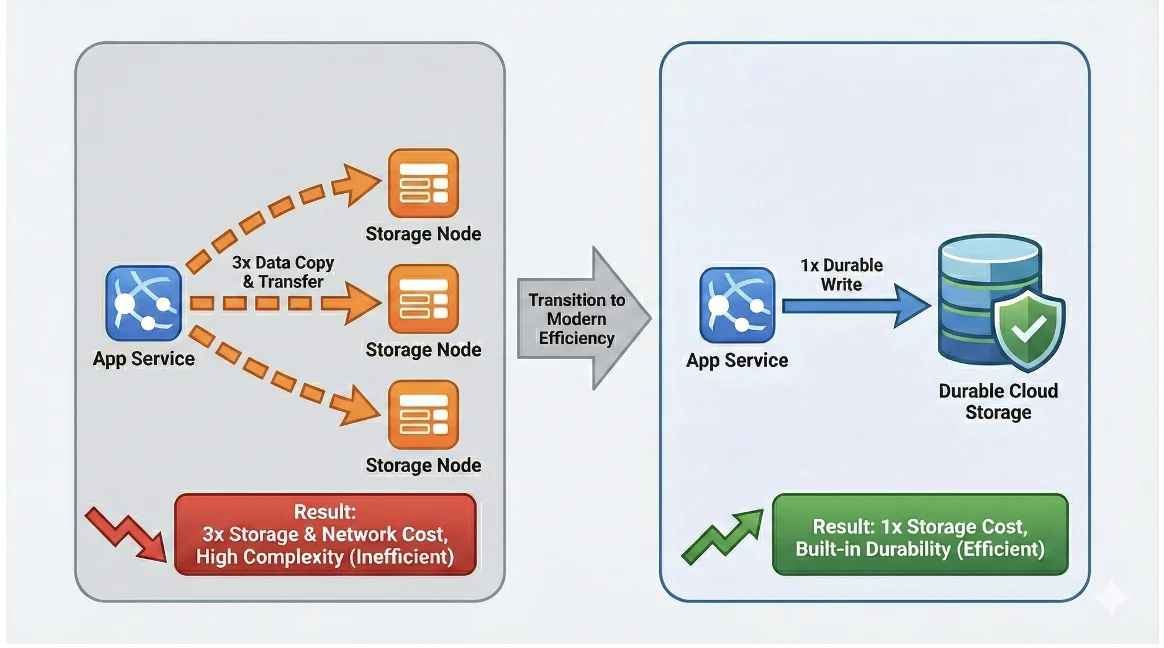
Beyond sampling, there is a deeper architectural inefficiency draining budgets called redundant replication.
Most distributed observability systems were designed over a decade ago when hardware was unreliable. To ensure data safety, the standard pattern was application-level replication where every log line or trace was written to three different nodes.
In modern cloud environments, this legacy pattern is a hidden tax.
1. The Cross-AZ Data Transfer Tax
In environments like AWS, high availability often means replicating data across multiple Availability Zones (AZs). While this is necessary for critical transaction databases, doing it for massive volumes of telemetry data incurs a penalty. Cross-AZ data transfer costs add a massive and often overlooked network line item to your bill.
2. Modern Infrastructure Is Inherently Durable
We are no longer building on flaky spinning disks. Modern cloud storage has massive redundancy built-in. Standard GP3 EBS volumes provide roughly 99.8% durability, while io2 volumes provide 99.999% durability. Object Storage like S3 goes even further with “11 9s” of durability.
At these levels of infrastructure reliability, paying for application-level replication by making three copies of your logs on three different nodes is redundant.
3. Simpler Durability Strategies
Platform teams can significantly reduce complexity and cost by relying on infrastructure durability rather than application complexity.
- For Cloud: Leverage high-durability volumes or offload to Object Storage immediately. This eliminates the need for complex consensus algorithms and cross-AZ traffic.
- For Self-Hosted: rely on hardware redundancy instead of network redundancy. This keeps traffic off your network and reduces complexity.
By choosing architectures that trust the underlying infrastructure, teams eliminate the “replication tax” and save money on storage, compute, and network traffic.
A Practical Path Forward for Platform Teams
The next quarterly review shouldn’t trigger another round of aggressive sampling. Platform teams should ask different questions.
First, audit telemetry quality. High-cardinality tags added without consideration, verbose debug logs abandoned in production, and health check traces that provide no debugging value all drive costs without improving incident response. Fix instrumentation at the source rather than filtering in pipelines.
Second, evaluate backend architecture honestly. Ask whether the observability platform was built for cloud-native workloads or retrofitted from business intelligence tools. Building an effective enterprise observability strategy requires evaluating architectural patterns alongside business requirements. Moving from 3x application replication to 1x infrastructure-backed storage can cut effective storage costs significantly and eliminate cross-AZ transfer fees.
Third, if sampling remains necessary, implement it with intention. Document what is sampled and why. Ensure sampling policies preserve the traces most likely to matter during incidents, such as errors, high-latency requests, and specific customer scenarios.
The goal isn’t eliminating all costs. It’s building an observability system platform teams can afford to trust at any scale.